Workspace administration
Understanding Your Practice Analytics
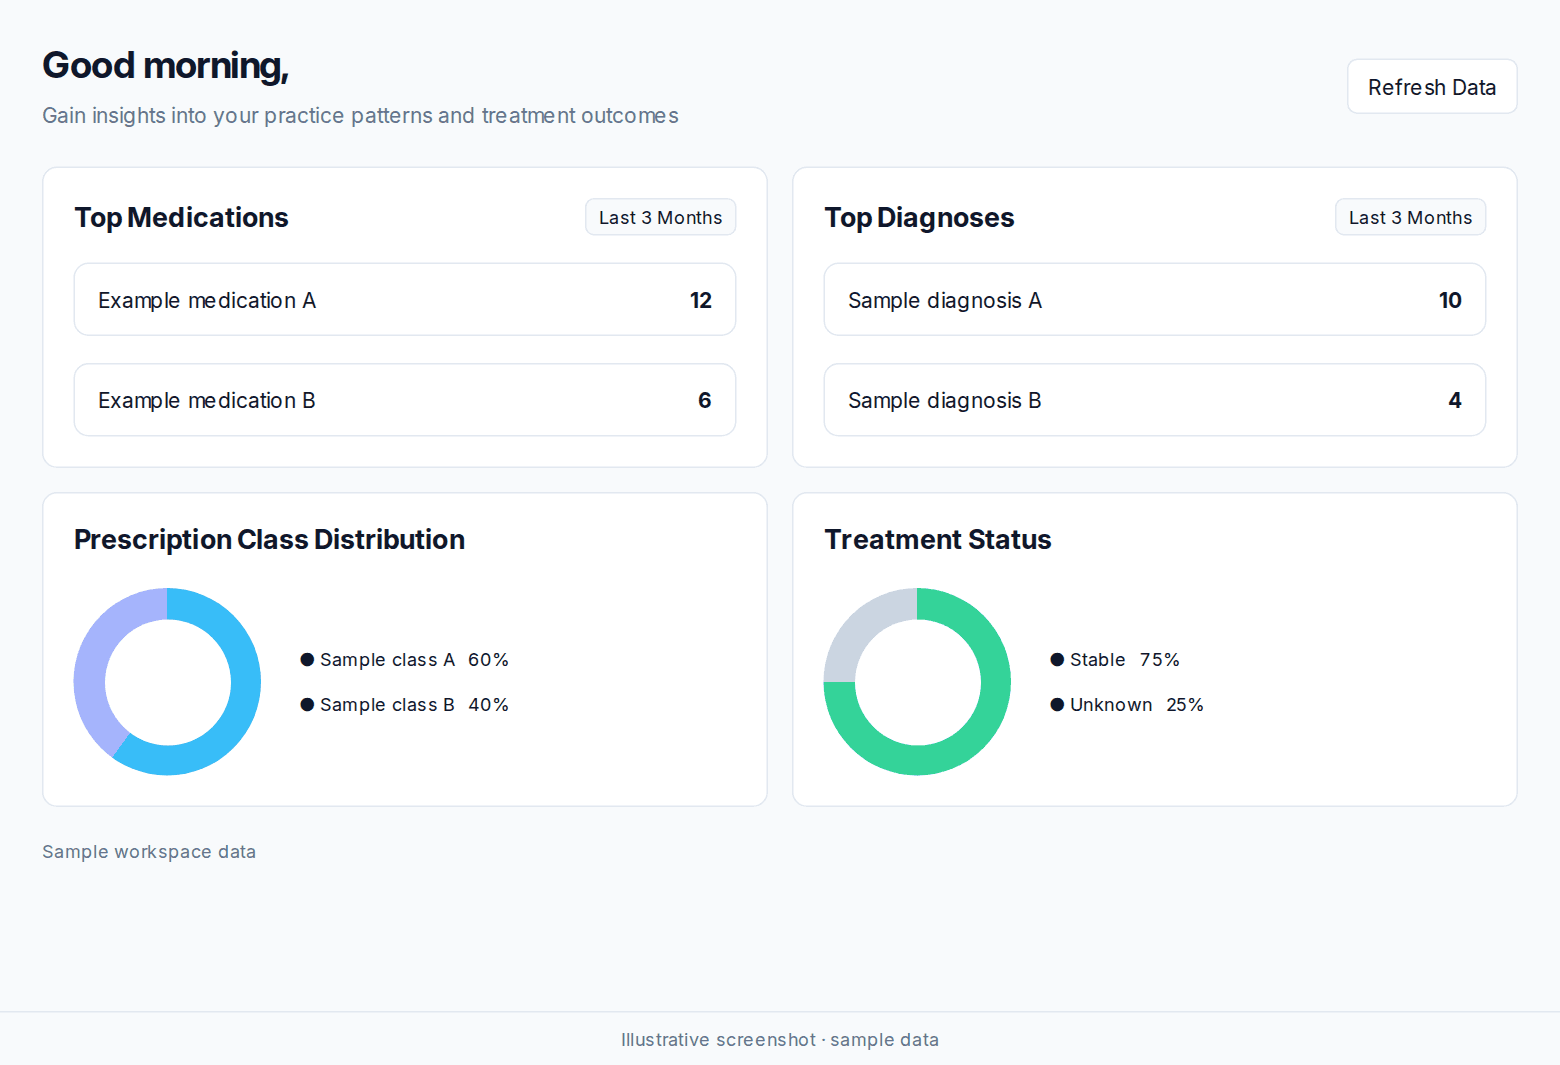
Analytics widgets: top medications, diagnoses, prescription classes, treatment status, and top users.
This dashboard is being updated. Current widgets:
Top medications
Displays your 5 most frequently prescribed medications from the last 3 months. Each entry shows:
-
Medication name
-
Generic name
-
Drug class
-
Total prescriptions
Click “Show All” to view all medications detected or prescribed during this period. Select any medication to access live clinical insights powered by AriaMD.
Top Diagnoses
Shows your 5 most common patient conditions, including:
-
Condition name
-
ICD-10 code
-
Description
-
Total occurrences
The widget shows diagnoses recorded in the last 3 months.
Prescription Class Distribution
A pie chart showing the distribution of medication types in your practice (SSRIs, stimulants, and other drug classes). Useful for reviewing prescribing patterns across therapeutic categories.
Treatment Status
AI-estimated breakdown of how your patients are progressing. Categories include Stable, Inconsistent, Declining, and others. Gives a quick snapshot of overall patient outcomes.
Top users
Shows which team members are using Nextvisit AI most frequently, useful for tracking adoption across your practice.
Was this article helpful?
Still stuck? Our team answers in the messenger.