Clinical history
Track Progress With AI Timeline
View key life events and treatment milestones automatically organized from your patient encounters.
Where to find the AI Timeline
In the patient chart:
-
Navigate to your patient’s chart
-
Click the Timeline or AI Timeline tab
During encounters:
- Look for the timeline widget in the right sidebar while documenting your progress note
How the timeline works
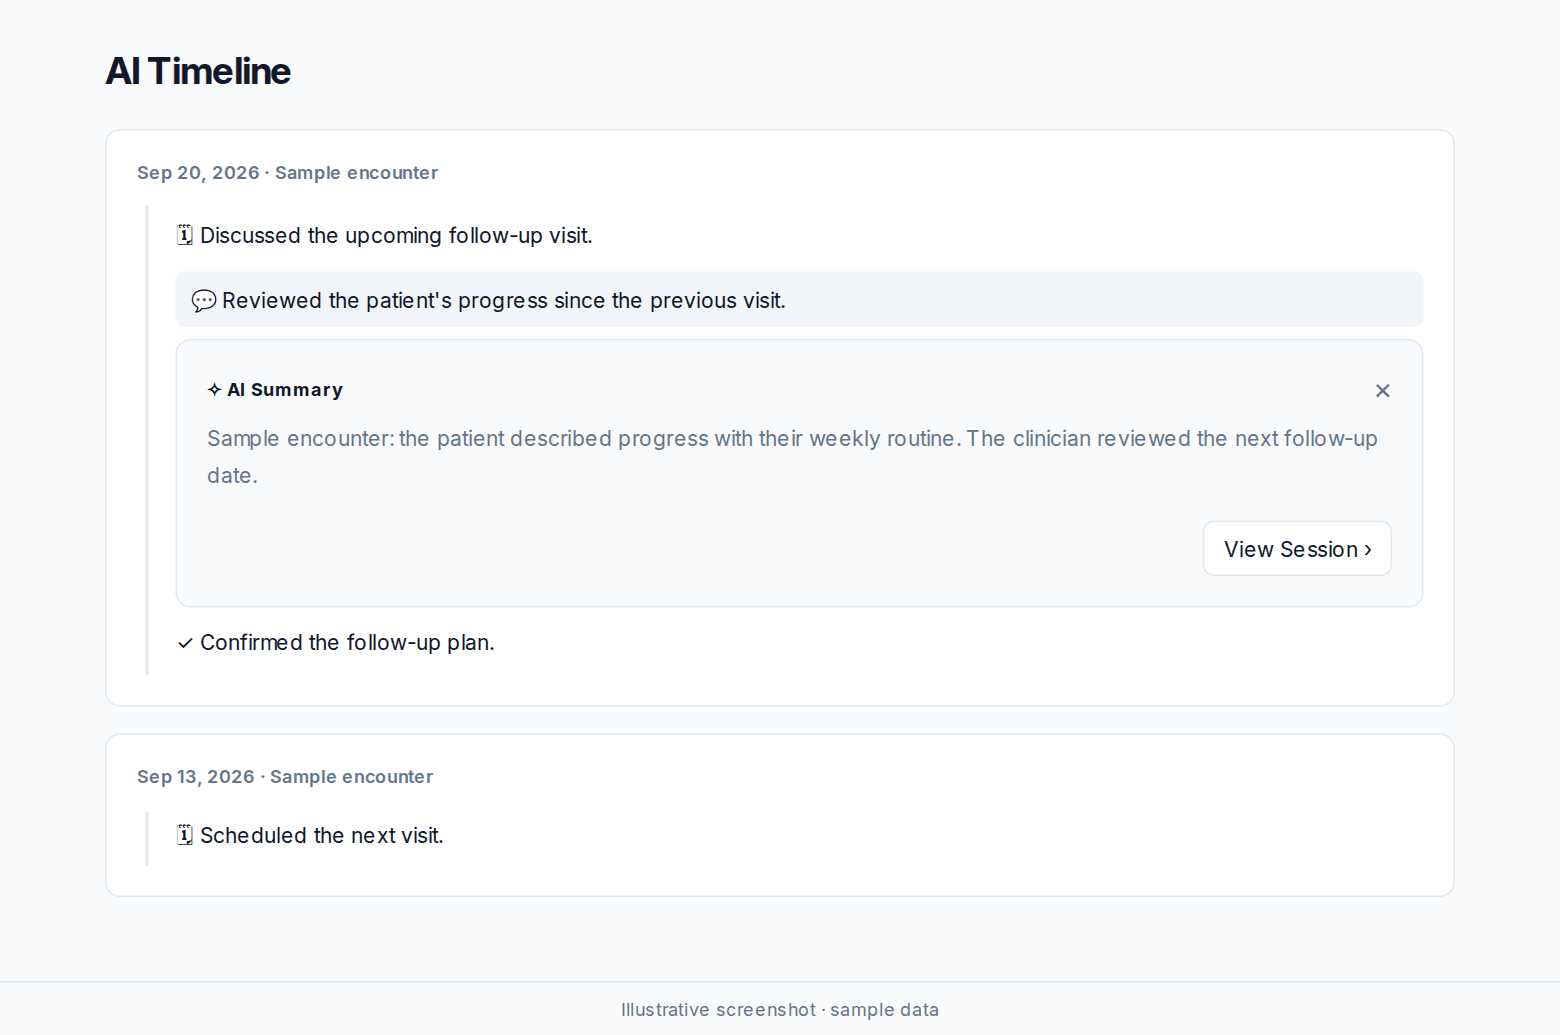
The AI identifies and displays 3-7 key events per session depending on encounter complexity. Each event includes:
-
An emoji that represents the event type
-
A brief, readable summary of what happened
-
Session grouping for easy navigation
Getting more details
When viewing the timeline from the chart or patient view, click any event to see:
-
Relevant history: Background context related to the event
-
Significant details: Important clinical information and observations
-
Changes: Updates to prescriptions, condition status, or other treatment modifications
-
Patient quotes: Direct quotes from the session when applicable and clinically relevant
Was this article helpful?
Still stuck? Our team answers in the messenger.